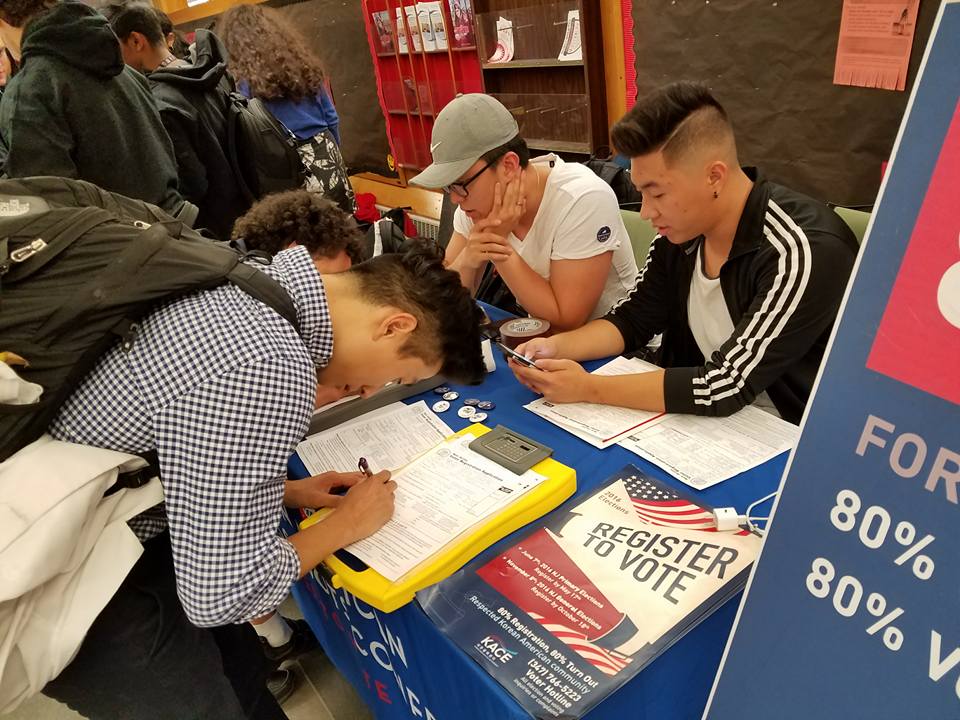
Why Should I Vote?
▹ Since 1996, Asian American and Pacific Islander groups have had the lowest voter turnout rates among other racial and ethnic groups in the United States. Even among college-educated voters, AAPI turnout has lagged behind that of White, Black, and Hispanic voters.
▹ However, voter turnout among Asian Americans increased significantly from 49% in 2016 to 59% in 2020, according to the U.S. Census Bureau. With over 15 million eligible Asian American voters, or 6.1% of the voter population, the AAPI community played a crucial role in deciding the fate of swing state elections in Georgia, Arizona and Nevada.
▹ It is predicted that the Asian American and Pacific Islander population is projected to rise to more than 35.8 million by 2060, or more than triple their 2000 population. The continued growth of the AAPI electorate will translate to greater political influence as the fastest-growing racial or ethnic group in the country.
▹ The double-digit surge in Asian American voter turnout demonstrates a critical shift in the perception of the Korean American community as a critical voting bloc, especially as elections are being determined by razor-thin margins.
Your Vote Matters.
▹ Your vote is one of the most direct ways for you, as a U.S. citizen, to influence the public policy-making process through civic participation. The leaders you elect represent your voice, your interests, and the future of your community.
Korean Alone
Korean + Combination
Top 10 U.S. State by Korean Population
| State | Korean + Combination | Korean Alone |
|---|---|---|
| California | 562,497 | 471,071 |
| New York | 142,143 | 120,360 |
| Texas | 111,701 | 80,664 |
| New Jersey | 109,856 | 98,046 |
| Washington | 97,176 | 66,682 |
| Virginia | 93,481 | 74,569 |
| Illinois | 73,353 | 58,909 |
| Georgia | 72,887 | 60,124 |
| Maryland | 59,919 | 47,867 |
| Hawaii | 56,202 | 25,632 |
Source: 2021: ACS 5-Year Estimates Selected Population Detailed Table
Top 10 U.S. Counties by Korean Population
| County | Korean + Combination | Korean Alone |
|---|---|---|
| Los Angeles County, California | 229,593 | 205,016 |
| Orange County, California | 112,041 | 100,568 |
| Bergen County, New Jersey | 63,558 | 60,909 |
| Queens County, New York | 51,484 | 47,295 |
| Honolulu County, Hawaii | 48,178 | 23,534 |
| Fairfax County, Virginia | 48,041 | 42,297 |
| Cook County, Illinois | 43,638 | 37,061 |
| King County, Washington | 43,622 | 31,124 |
| Santa Clara County, California | 38,805 | 32,903 |
| San Diego County, California | 30,162 | 21,692 |
Source: 2021: ACS 5-Year Estimates Selected Population Detailed Table
Top 10 U.S. Congressional District by Korean Population
| Congressional District | State | Korean Population |
|---|---|---|
| Congressional District 5 | New Jersey | 52,742 |
| Congressional District 34 | California | 52,489 |
| Congressional District 3 | New York | 28,801 |
| Congressional District 6 | New York | 24,835 |
| Congressional District 47 | California | 23,076 |
| Congressional District 36 | California | 21,825 |
| Congressional District 38 | California | 21,777 |
| Congressional District 30 | California | 20,987 |
| Congressional District 17 | California | 18,061 |
| Congressional District 7 | Georgia | 17,553 |
Source: 2022: ACS 1-Year Estimates

KAGC HELPS YOU
As the largest nationwide network of Korean American voters, KAGC is here to help you exercise your voting rights and make an informed choice.